











A Unified View
Of Your Entire IT Ecosystem
One platform unifying monitoring across the data center, infrastructure, cloud and communications — with AI-powered proactive analytics, ready-made dashboards, and deployment on-premise.
One Monitoring Platform Instead of Dozens of Scattered Tools
Trace9 unifies monitoring, analytics and alerting in one place, giving your teams a complete, real-time picture of the health of the entire ecosystem.
Monitors Everything in Your Technology Ecosystem
From devices and networks to cloud, power systems and IoT — one single source of truth
Applications
Networks & Firewalls
Control Systems
Cloud Services
Servers & Virtual Machines
Storage & Databases
Services & Value Chains
Power Systems & UPS
IoT & Sensors
SupportsSNMPandSSH, agent-based and agentless collection, APIs and more
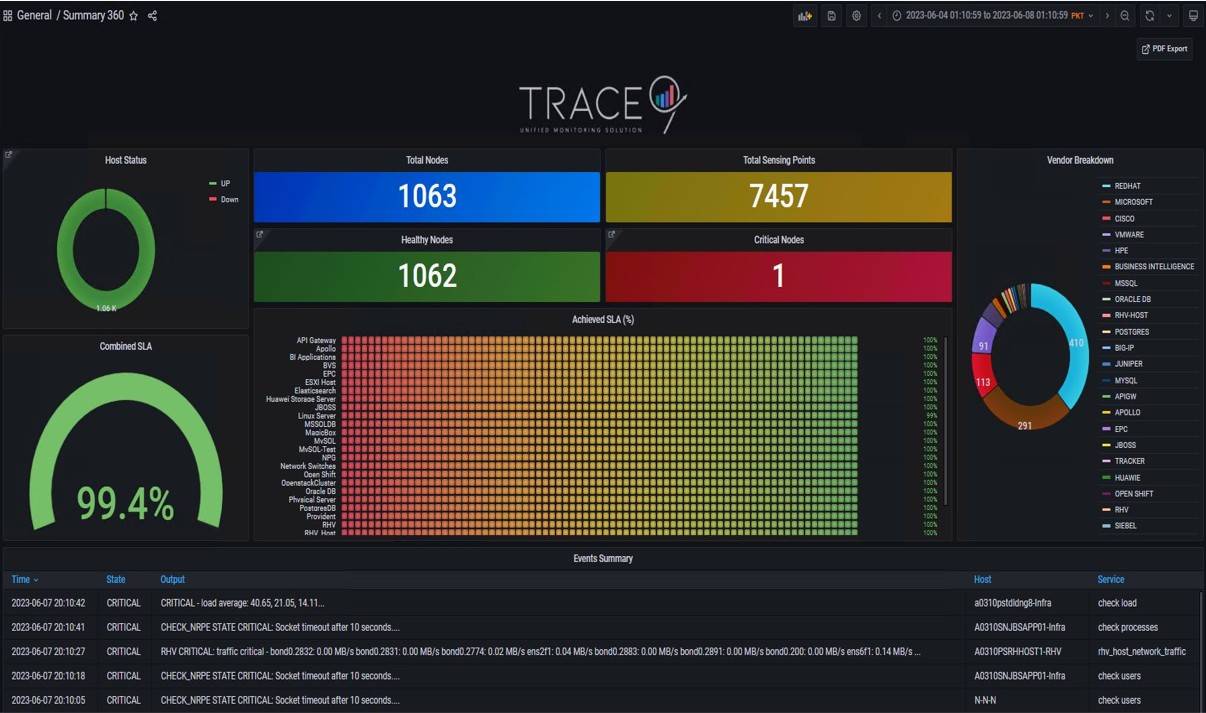
A Complete Picture for Running the Organization in One Dashboard
Ready-made, customizable dashboards showing ecosystem health, availability and compliance in real time — with report export
* Illustrative figures from a sample dashboard to show the display format
Monitoring Capabilities Covering Every Layer of the Ecosystem
One platform for all IT domains — switch between areas to explore the details
Built for Organizations That Never Stop
A strong, scalable and future-ready architecture — from automatic discovery to agentic AI
Automatic Discovery & Correlation
Discover assets automatically and correlate events to identify root causes quickly.
Distributed & Highly Available
A distributed, highly available and scalable architecture covering thousands of nodes without bottlenecks.
Customizable Dashboards & Reports
Ready-made, editable dashboards and scheduled, exportable reports for every audience.
Flexible Thresholds & Alerts
Dynamic thresholds and customizable alerts and notifications across different channels.
Third-Party Integration
Broad integration via API, NBI and plugins with your existing systems.
DevOps Services & Support
DevOps and professional services with full support, backed by IOTA solutions and GO services.
Agentic AI Roadmap
Continuous evolution toward agentic AI to automate remediation and response.
SLT/SLA & License Management
Monitor service level agreements and manage licensing and compliance from a single dashboard.
Clear Value for Every Role in the Organization
From strategic leadership to day-to-day operations teams — everyone gets what they need
Chief Information Officer (CIO)
IT Manager
System & Network Administrator
Network Operations Center (NOC) Teams
From Discovery to Full Visibility, Fast
A flexible deployment approach — on-premise or as a managed service — without disrupting your business
Discovery & Inventory
- Automatic discovery of all assets
- Topology and dependency mapping
- Defining the monitoring scope
Deployment & Integration
- On-premise deployment or from Go Telecom's operations center
- SNMP, SSH, agent and API integration
- Connecting systems and third parties
Dashboards & Alerts
- 360° dashboards ready instantly
- Configuring thresholds and alerts
- Exportable SLA reports
Analytics & Operations
- AI-powered predictive analytics
- Proactive 24/7 monitoring
- Continuous performance optimization
Ready for a Unified View of Your Entire IT Infrastructure?
Book a live demo and see how Trace9 unifies your monitoring and predicts failures before they happen.